Most of us like hot things. Hot meal, hot bath or hot weather. Some of us also like the hot state of serverless services without paying too much for it. In this post you can find out how to keep Cloud Run in hot state for free🔥
Cold and Hot states
In a previous blogpost you could read what Cloud Run is and it’s basics. For serverless services we can use the convention of having service in cold and hot states. Best scenario is when our service is always in hot state as it’s ready for responding to requests instead of booting every time.
Cold State
Service is “turned off” and sleeping. Often we are not paying for it and any incoming request needs to wait until service is woken up and ready for receiving requests.
In Cloud Run, cold state means that the Docker container is turned off and before the request can be handled we need to wait for the startup process (entrypoint script + app startup) of our program to end. It can differ from a few milliseconds to even a few minutes if we have a monolithic application (I saw this behaviour when I tried to run Keycloak on Cloud Run).
I have prepared a simple Go app which sleeps 5s before starting the server. In logs we can see that this will happen every time when an app is killed/exited and started again or a new revision is created. Users or other services will need to wait until all startup is done.
Other services calling it will have to wait and will be billed for it, so it’s not the best situation for us.
Hot State
This means that our app is ready for receiving requests. In a non serverless world it’s equivalent to just running an application all the time.
In Cloud Run hot state means that our container is not sleeping and is ready to handle requests even when in recent seconds/minutes it did not get any request. When you get eg. one request per second or half minute, it should be handled without any delay.
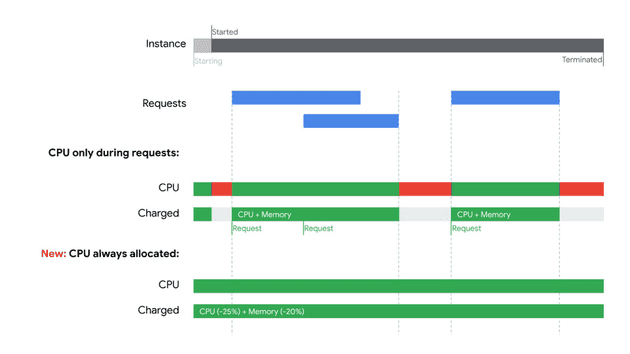
We need to also remember about CPU allocation which can be “request only” or “all the time” when an instance is live.
This is the best scenario for us and our users. From my experience, on production environments with stable and ongoing traffic we should have a hot state all the time.
But in case when we have differential traffic and non 24/7 our users might experience slowdowns or even timeouts. Below I’ll explain how to prevent this and keep users, business and devops happy.
You should optimize your app startup too as there is no guarantee that any of keeping hot methods will always work. If you don’t want to play with this you can always set a minimum instance count and have a hot state all the time but pay for it.
Rub your services?
When you are feeling cold you drink something hot, put on more clothes or rub yourself. I do not recommend trying the first two with your services but the third one option is possible!
If you manage to do the first two, contact me!
Are you alive aka health check
The simplest option is to do a regular health check of your service to monitor its state. This is what you should do by default (monitoring services).
Using a health check can be different depending on access type to your service.
Case 1 - my service has public URL and no auth
If you allow a public URL in Cloud Run (everyone can access it, IAM set to AllUsers Cloud Run Invoker) you can use any ping/health check service you have. In this scenario we can use GCP Operations uptime check and endpoint in your service which can even respond with only “pong” on default / path or /health.
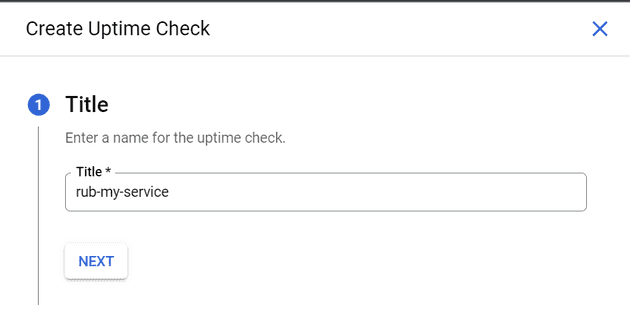
To set this go to GCP Console -> Monitoring -> Uptime Check.
- Set name of your uptime check. I’ll call mine “rub-my-service”.
- Next we need to set how Monitoring will reach our service. For Cloud Run we set a public URL and optionally path to the endpoint. For basic uptime check we can leave default options. For the scheme we set HTTPS (as we can’t have an insecure endpoint with Cloud Run <3) and provide a url to it.
- Next we can leave default settings for response timeout, skip content matching and not set alerts (but I recommend setting it). Before clicking “save” click “test” and you should see a green box with a successful response.
This will keep our service in hot state all the time with minimal cost (even 0$ if we keep it in free tier or requests/cpu/memory).
Runtime environment generation differences.
I have observed that for the First Generation runtime environment we can use a 5 minutes check frequency as it’s enough to keep the container in a hot state while when I was using Second Generation (beta) I had to set a 1 minute frequency check as my container tends to go to a cold state during a silent period.
Case 2 - my service has GCP Auth enabled
Now stuff gets a little more complicated. For now I did not find a way to leverage Uptime Check service with Auth enabled. When you try you’ll get just 403 responses and requests will not reach your app/container as they are blocked at GCP infra level.
We have at least two options:
I’m a greedy option
Often you have another service which is using your “authed” service and is a public one. Use it to do a health check of “authed” one with the previous strategy. If you use trace with your services you’ll be able to additionally monitor performance of this chain of requests.
I can spend penny option
If you are ok with spending “$0.10 per job per month” you can use Cloud Scheduler for this. It can use IAM Service Account with Cloud Invoker role which enables us to ping service with Auth enabled.
- First we set the name, crontab and timezone of the job. I’ll set it to ping my service every 5 minutes.
- Next we need to set a target. For Cloud Run use HTTP with full URL including schema. For Auth set OIDC token with created Service Account. Remember to set IAM permission Cloud Run Invoker for this Service Account in deployed service. You can read more about it in service-to-service auth docs.
- You can leave the retry option with default settings. After the job is created click “Run Now” and you should see “Last run result” as “Success”.
Case 3- my service has ingress set to internal
For this case even when we set allow unauthenticated invocation we’ll get a 403 response when trying to access the URL. Resources which are trying to access your service needs to be in the same VPC which is not possible with all GCP products.
To read more about internal services ingress with Cloud Run visit docs.
As we see in docs, we can access our service using PubSub, EventArc or Workflows. The simplest way will be to use the previous Cloud Scheduler method with PubSub push subscription.
When you set your scheduler to use PubSub your message will reach your service but with POST method instead of GET so you need to be ready to handle it.
- Cloud Scheduler connected to PubSub will return Success every time if it’s properly configured so we can’t use this method to monitor the health of our service.
- PubSub uses push to our Cloud Run internal service. We can use OIDC token if we set Auth required for our service.
- PubSub POST requests can reach our service and ping it.
There are few other methods which can leverage Workflows or creating serverless connectors but I think the described one is the simplest one if you just want to ping your service from time to time.
Self rubbing…
Some say that you can go blind when you do it ( ͡° ͜ʖ ͡°) but our services should be safe. This is not the prettiest way to keep services hot but is kind of an option.
Your container will receive a system event SIGTERM. From this time you have 10 seconds to handle it. Often you close DB connections, flush logs and traces and prepare app to close before receiving SIGKILL.
Solution is to use this 10s period to do a request to itself and make service in hot state again.
Using this simple Go program you can see how this can work. Again, I’m not recommending this solution but it works.
package main

import (
	"fmt"
	"log"
	"net/http"
	"os"
	"os/signal"
	"syscall"
)

func hello(w http.ResponseWriter, req *http.Request) {
	fmt.Fprintf(w, "hello\n")
}
func health(w http.ResponseWriter, req *http.Request) {
	fmt.Fprintf(w, "pong\n")
}

func main() {

	sigc := make(chan os.Signal, 1)
	signal.Notify(sigc, syscall.SIGTERM)
	go func() {
		s := <-sigc
		fmt.Printf("caught signal %s: selfrubbing...\n", s)
		_, err := http.Get("https://selfrubtest-x2hv5vxupa-lm.a.run.app/health")
		if err != nil {
			log.Fatalln(err)
		}
	}()
	http.HandleFunc("/", hello)
	http.HandleFunc("/health", health)
	http.ListenAndServe(":8080", nil)
}
Summary
As you can see there are multiple ways to keep your Cloud Run services in hot state for free or very cheap. This will make your users, other services and devops team happy. In next blog posts we’ll look at other features of Cloud Run. If you have any questions on this topic let me know in the comments :)


